Defining Home Pages with a Text Editor
Home Pages: Metric Values Chart Panel
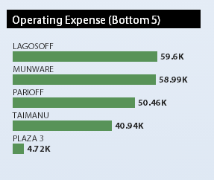
This type of panel presents the most recent set of metric trend values data for a particular metric. It is useful for getting a quick handle on the best-performers and worst performers for a particular key-performance indicator.
A typical descriptor for a metric values chart is:
<bucket
title="Operating Expense (Top 5)"
type="app-specific"
controlType="horizontalBarChart"
metricName="fin_RealEstateOpEx"
granularity="bl_id"
sortOrder="desc"
recordLimit="5"
valueOnTop="smallest"
useStoplightColors="true"
/>
controlType. A value ofhorizontalBarChartspecifies that the home page should invoke the horizontal bar chart control, which has a special facility for charting metric values.metricName. The name of the Archibus Metric (afm_metric_definitions.metric_name) to chart.granularity. The level of granularity to chart. If you are comparing performance of Buildings this would be Building Code (bl_id); if you are comparing performance of Business Units, this would be the Business Unit Code (bu_id), etc. You can only chart a granularity that the Metrics Framework collects for that metric; that is, the Archibus Metric Granularity Definitions (afm_metric_grans) table must define the specified granularity for that metric. You typically won't chart the 'all' granularity, since there is only one record per metric.sortOrder. Isascor ascending if the metric is to display the smallest values ordescor descending if the metric is to display the largest values. Please note: you can use this attribute with a metric values chart; however, you cannot use thissortOrderattribute with the standardhorizontalBarChartdriven from a view's datasource, as in that case, the datasource specifies the ascending or descending order.valueOnTop. Issmallestorlargestdepending on whether you want the smallest values in the sort order or the largest values to display first.useStoplightColors. Iftrue, the control will display each bar as green if the metric for that performer is within its target boundaries, yellow if the metric is over its warning limits, and red if the metric is over its critical limits. Iffalsethe bars display in dark grey.